Our Key Strengths
- Derby is one of the most important drivers of the Midlands and national economies. The City is home to 126,750 jobs – it generates more jobs per head than the D2N2 area and the country as a whole[1].
- There are more jobs in the Derby economy since 2011. Employment growth has been positive with almost 6,500 more jobs in the city – founded on the strong growth in manufacturing (+2,120), office-based administration (+1,640), hospital healthcare (+1,140) and higher education (+730)[2].
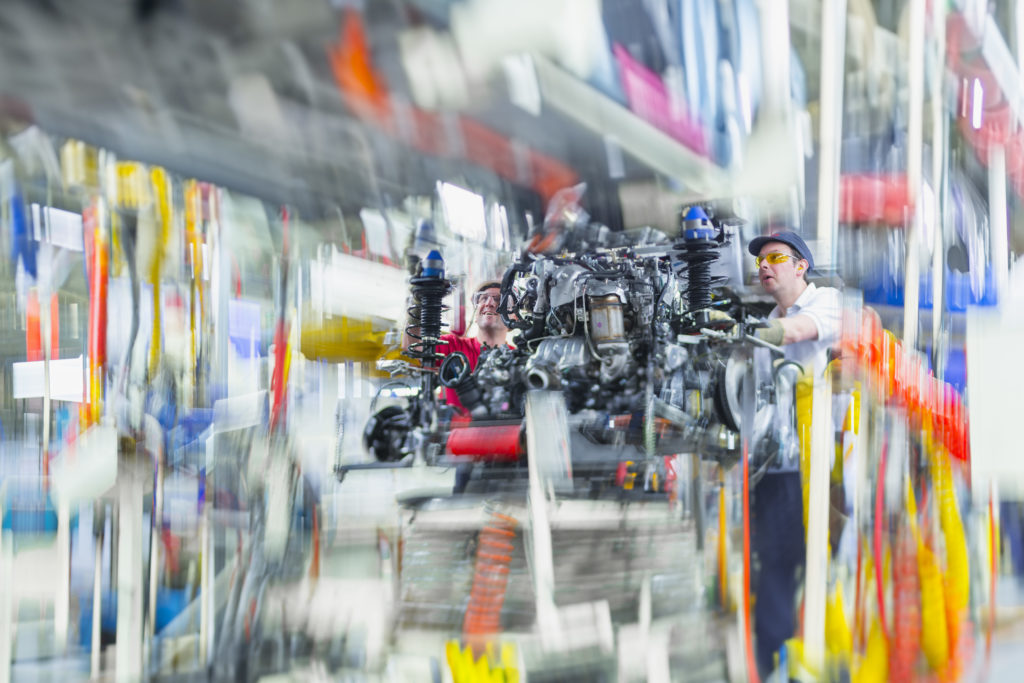
- Derby is distinguished by its national reputation as a ‘producer’ city with a private sector jobs base driven by manufacturing and engineering. In a City with a proud industrial heritage, innovation amongst Derby’s key businesses has seen the manufacturing sector continue to grow, in contrast to trends elsewhere in the UK where the structural transition towards a service-based economy has often led to shrinking production industries.[3]
- Derby’s is home to major international producer businesses – notably Rolls-Royce and Bombardier; and Toyota which lies just outside the City. These global brands raise the national and international profile of Derby and support extensive supply chains.
This means that the City’s jobs base is more concentrated into a smaller number of larger businesses than at wider levels regionally and nationally[4]. While the benefits of these major employers are clear, there is room for further diversification, both in types of employment and business density to ensure the ongoing resilience and value of the city economy.
- Workers and businesses in Derby are highly productive – adding value to the national economy. Output (GVA) per worker in Derby is considerably higher than the D2N2 average and is in line with the national average[5]. In four of the five years between 2011 and 2015, GVA growth in Derby exceeded the national trend. On average, manufacturing jobs in Derby generate almost 40% more economic value each year than those across the sector nationally[6]. At £28,650, average earnings of Derby residents are £400 higher than the UK and over £2,000 higher than the average across the East Midlands[7].
- Derby has achieved continued productivity gains in recent years. The average worker (2015) in Derby generates 10% more economic output than in 2011, with GVA per job increasing by over £5,000 in five years[8].
- Since 2011 the city has more people working in science, technology and engineering professions in Derby. Growth in knowledge-intensive business services (KIBS) in Derby has been driven by employment in technical activities (+613) and engineering (+485)[9]. Between 2011 and 2016 Derby generated over 900 professional ‘STEM’ roles, a growth of 9%[10].
Christine Durrant from Derby City Council
Our Key Challenges
- Higher-value business services remain under-represented in Derby. Cities are increasingly the focus for such activities, which in turn are key to future productivity and attracting tomorrow’s wealth creators. Derby is not keeping up with wider trends. The share of jobs in knowledge intensive business services (KIBS) in the City is 12% compared to 14% nationally. Between 2011 and 2015 the total number of jobs in this sector grew much faster across D2N2 (+10%) and nationally (GB, +13%) than it did in Derby (+4%)[11].
To sustain and grow the strong productivity levels in the Derby economy, more needs to be done to support growth and diversification of the higher-value service sector to complement its recognised success in productive sectors.
- There is a ‘missing middle’ of work in Derby for skilled workers. The profile of work in Derby has polarised since 2011 as the City saw the number of skilled jobs shrink by 5,900 (-18%). Compared to 2011, more Derby jobs are in higher-order managerial, professional and technical roles (+3,800; 7% growth); but more are also in lower-order unskilled service (+10%) and manual work (+20%).[12]
- There is an ongoing mismatch between the skills of city residents and the needs of many city businesses. While 44% of Derby jobs are in higher-order occupations – managerial, professional and technical – this includes a proportion of workers living outside of the City[13]. As might be expected of a tightly-bounded City with an attractive rural hinterland, Derby draws some of its highly-skilled labour from outside its boundary, a missed opportunity for Derby’s own local labour pool and for retaining economic value and spending in the city.
Fewer people (16-64) in Derby have a higher-level qualification (NVQ4+) than the national average (Derby 33%; UK 38%). The skills deficit is particularly acute at the entry-level – a key issue is the level of basic employability in the labour market[14].
- Derby has a clear gap between the value of employment in Derby and the economic wellbeing of its residents partly because of strong labour flows to and from the city – in particular to surrounding districts. The average (median) job in Derby pays £32,300 whilst the average resident earns £28,650 – a gap of £3,650 (11%)[15].
Encouragingly, this gap has closed significantly since 2010, when the difference between average job value (median) and average resident earnings was £5,900 (18%). Continued progress in creating more higher-value jobs will be required to ensure that the City’s residents have the opportunity to share in its future economic growth.
- The benefits of Derby’s growth are not spreading across the whole-city. As with many large urban centres, Derby has a greater share of more deprived households than the national average – almost a fifth of local neighbourhoods (LSOAs) fall within the 10% most deprived nationally[16]. Encouragingly, however, unemployment (JSA claimant count, % 16-64) was line with or below the national average for the two and half years to mid-2017[17].
Footnotes
[1] Jobs density 2015: Derby: 87 jobs per 100 working age residents; D2N2 76/100; GB 83/100 (BRES Employment, 2015; ONS Mid-Year Population Estimates, 2015).
[2] Employment growth 2011-15: +6,458 net change in City of Derby (BRES Employment, 2011 and 2015)
[3] Manufacturing growth 2011-15: +2,120 net change in City of Derby employment in manufacturing (BRES Employment, 2011 and 2015)
[4] Business density (2016): 343 businesses per 10,000 population compared to 397 in D2N2, 459 in Great Britain (UK Business Counts Local Units and Mid-Year Population estimates 2016)
[5] GVA per person in employment (2015): Derby £54,690, D2N2 £47,040, Great Britain £54,702 (ONS Regional Gross Value Added, 2015; BRES Employment, 2015)
[6] GVA per person in employment in manufacturing in Derby (2015): Derby £94,500; GB £68,000 (ONS Regional Gross Value Added, 2015; BRES Employment, 2015)
[7] Median annual wage of residents (2016): Derby: £28,654; East Midlands: £26,593; UK: £28,213 (ONS Annual Survey of Household Earnings, 2016)
[8] Growth of GVA per person in employment (2011-15): GENECON analysis of UK Business Counts Local Units
[9] Growth in technical activities and engineering consultancy (2011-2015): (BRES employment 2011 and 2015 3 digit SIC analysis)
[10] Growth in professional ‘STEM’ roles (2011-2016): Science, Research, Engineering and Technology Professionals (SOC2010): 10,400 (2011); 11,300 (2015) (ONS Annual Population Survey, Workplace Occupations, 2011 and 2016)
[11] Employment in Knowledge Intensive Business Services (2011-2015): Derby 2011: 15,000; 2015: 15,550 (GENECON analysis of BRES Employment, 2011 and 2015: using sector definition developed by Centre for Cities)
Knowledge Intensive Business Services are labour and human capital intense services that provide expert professional, technical and creative knowledge as inputs to the business processes of other organisations. The sector is associated with innovation and economic development and is widely viewed as leading the transition from industry-based to information-based economic systems. This report uses the Centre for Cities KIBS definition, which includes the following activities:
| Information services | Software development and publishing, data processing and hosting, computer system design and management. |
| Financial services | Banking and lending, investment and fund management, insurance and pensions |
| Professional services | Legal services, accounting, auditing and tax activities, corporate head offices, management consultancy |
| Property services | Building project development, quantity surveying, real estate trading and management, architectural, planning and environmental consultancy |
| Marketing services | Public relations, advertising and market research |
[12] Polarisation of work on offer in Derby and decline of skilled workers: (ONS Annual Population Survey, Workplace Occupations, 2011 and 2016)
[13] More higher order jobs in the City than residents working in higher order jobs: (ONS Annual Population Survey, analysis of Tier 1 Workplace and Residents Occupations, 2011 and 2016)
[14] Basic qualifications: the proportion of Derby’s workforce with no formal qualifications (9.3%) is higher than national and regional averages (GB 8.3%; EM 7.5%; D2N2 8.1%) (ONS Annual Population Survey 2016)
[15] Median annual wage of residents (2016): Derby: £28,654; Median annual wage of workplace jobs £28,650 (ONS Annual Survey of Household Earnings, 2016)
[16] Deprived households and LSOAs: 18.5% of Derby LSOAs are in the 10% most deprived in England (DCLG 2015 Index of Multiple Deprivation, Local Authority analysis)
[17] Job seekers allowance trends: (ONS Claimant Count, proportion of 16-64)